Section 1.5第 1.5 节 separated two sources by choosing the projection of the whitened data with the largest absolute kurtosis. The reasoning was a heuristic drawn from the central limit theorem: a sum of independent variables tends to be more Gaussian than the variables themselves, so a projection that mixes several sources looks more Gaussian than a projection that equals one source, and the least Gaussian projections should be the sources. Chapter 4第 4 章 showed that the sources are determined by the distribution of the data; this chapter shows that, for kurtosis, the heuristic is a theorem, and then examines what the theorem costs in practice.
ICA usually involves a handful of sources, so the limit theorem itself is not what matters. What matters is a statement for finitely many terms: a combination of independent sources sits, in a precise sense, between the sources and the Gaussian. For kurtosis the statement is simple. If s1,…,sn are independent with unit variance and the same kurtosis κ, then their normalized sum n−1/2∑isi has kurtosis κ/n, and no unit-variance combination has kurtosis larger in absolute value than the most kurtotic source (Proposition 5.1命题 5.1). The analogous statement for entropy is taken up in Chapter 6第 6 章.
Throughout the chapter the data are whitened, z=A~s, with A~ orthogonal and independent zero-mean sources of unit variance and finite fourth moments ((3.2)). A one-unit method looks for a unit vector w such that y=w⊤z is a source. In source coordinates, q=A~⊤w, the projection is y=q⊤s, and ∥q∥=∥w∥=1 because A~ is orthogonal; in particular E[y2]=∥q∥2=1. Searching over unit vectors w is therefore the same as searching over unit vectors q, and y is a source exactly when q=±ei, a standard basis vector.
本章始终假定数据已经白化:z=A~s,其中 A~ 是正交矩阵,各源独立、均值为零、方差为一且四阶矩有限((3.2))。单单元方法寻找一个单位向量 w,使 y=w⊤z 是某个源。在源坐标 q=A~⊤w 下,投影为 y=q⊤s;由于 A~ 正交,∥q∥=∥w∥=1,特别地 E[y2]=∥q∥2=1。因此在单位向量 w 上搜索,等价于在单位向量 q 上搜索;而 y 恰为某个源,当且仅当 q=±ei 是标准基向量。
The same idea appeared earlier in exploratory statistics as projection pursuit. Friedman & Tukey (1974) proposed to explore multivariate data by numerically optimizing a "projection index" over one- or two-dimensional projections. Huber (1985) argued that the Gaussian is the least interesting distribution, since most projections of high-dimensional data look nearly Gaussian, so that a projection index should measure departure from Gaussianity. One-unit ICA contrasts are projection indices of exactly this kind, applied to whitened data; under the ICA model the interesting directions are the sources (Hyvärinen, Karhunen & Oja, 2001).
For a zero-mean variable, kurt(y)=E[y4]−3(E[y2])2 is the fourth cumulant (Definition 2.10定义 2.10). It vanishes for the Gaussian; variables with kurt(y)<0 are called sub-Gaussian (uniform: −1.2; a binary ±1 variable: −2, the smallest possible value at unit variance) and variables with kurt(y)>0super-Gaussian (Laplace: 3; centered exponential: 6). As a cumulant it has two properties that drive everything in this chapter: for independent u and v and a real number α,
If ∥q∥=1, then ∣kurt(q⊤s)∣≤maxi∣κi∣. When maxi∣κi∣>0, equality holds only for q=±ej with ∣κj∣=maxi∣κi∣. If all κi equal κ, then kurt(q⊤s)=κ∑iqi4 lies between κ/n and κ, and the value κ/n is attained when all qi2=1/n.
The identity follows from additivity over the independent terms qisi and from kurt(qisi)=qi4κi. For a unit vector, ∑iqi4≤(∑iqi2)2=1, with equality only when a single qj is nonzero; hence ∣∑iqi4κi∣≤maxi∣κi∣∑iqi4≤maxi∣κi∣, and equality in the last step forces q=±ej, after which the first step forces ∣κj∣=maxi∣κi∣. Finally, by the Cauchy–Schwarz inequality, 1=(∑iqi2)2≤n∑iqi4, with equality exactly when all qi2 are equal.
Three consequences shape the rest of the chapter. First, mixing can never produce more absolute kurtosis than the most kurtotic source contains, which is the precise form of the central-limit heuristic. Second, a mixture can still be more kurtotic than some of the sources: mixing a nearly Gaussian source with a Laplacian one gives a combination that is less Gaussian than the first source. Third, kurtoses of opposite signs can cancel: for a uniform and a Laplacian source, kurt(cosθs1+sinθs2)=−1.2cos4θ+3sin4θ vanishes at tan4θ=0.4, that is θ≈38.5∘, although this combination is certainly not Gaussian. Kurtosis is a signed measure, and the quantities to maximize are ∣kurt∣ or kurt2.
By Proposition 5.1命题 5.1, the one-unit contrast in source coordinates is the quartic form F(q)=∑iκiqi4 restricted to the unit sphere, and ∣kurt(w⊤z)∣=∣F(A~⊤w)∣. The map w↦A~⊤w is an isometry of the sphere, so local maxima in w and in q correspond. The global maximum of ∣F∣ sits at a source with the largest ∣κi∣. The question that matters for algorithms, which climb from a random starting point, is whether ∣F∣ has other local maxima. We first find all critical points of F on the sphere (see Section A.7第 A.7 节 for the Lagrange conditions).
由Proposition 5.1命题 5.1,在源坐标下,单单元对比函数就是限制在单位球面上的四次型 F(q)=∑iκiqi4,且 ∣kurt(w⊤z)∣=∣F(A~⊤w)∣。映射 w↦A~⊤w 是球面的等距变换,所以 w 与 q 中的局部极大点一一对应。∣F∣ 的全局最大值出现在 ∣κi∣ 最大的源处。对从随机起点出发向上爬的算法来说,真正要紧的问题是:∣F∣ 还有没有别的局部极大点?我们先求出 F 在球面上的全部临界点(拉格朗日条件见Section A.7第 A.7 节)。
Lemma 5.2 (critical points)引理 5.2(临界点)
A unit vector q is a critical point of F on the sphere if and only if there is a number μ with κiqi2=μ for every i in the support S={i:qi=0}. Either μ=0, in which case κi=0 on S and F(q)=0; or μ=0, in which case all κi with i∈S are nonzero and have the sign of μ, and
单位向量 q 是 F 在球面上的临界点,当且仅当存在数 μ,使对支撑集 S={i:qi=0} 中的每个 i 都有 κiqi2=μ。此时要么 μ=0,于是在 S 上 κi=0,且 F(q)=0;要么 μ=0,于是所有 i∈S 的 κi 都非零且与 μ 同号,并且
qi2=κiμ(i∈S),μ=(i∈S∑κi1)−1=F(q).(5.2)
Proof.证明
On the sphere, q is critical exactly when ∇F(q)=4(κ1q13,…,κnqn3)⊤ is parallel to q, that is κiqi3=μqi for all i and some μ. For qi=0 this reads κiqi2=μ. If μ=0, then qi2=μ/κi>0 forces the sign condition, and ∑i∈Sqi2=1 gives the value of μ. Finally F(q)=∑i∈S(κiqi2)qi2=μ∑i∈Sqi2=μ.
Every single-source point ±ei is critical, with μ=κi. The critical points with ∣S∣≥2 mix sources whose kurtoses share a sign, with weights qi2∝1/κi; the theorem below shows that none of them is a local maximum of ∣F∣.
Let z=A~s with A~ orthogonal and independent sources of zero mean, unit variance and kurtoses κ1,…,κn, not all zero. The local maxima of K(w)=∣kurt(w⊤z)∣ on the unit sphere are exactly the points w=±a~i with κi=0, where a~i is the i-th column of A~; there w⊤z=±si. Each of them is a strict local maximum, and the global maximum value of K is maxi∣κi∣.
Work with ∣F∣ in source coordinates. Sources are strict local maxima. Let κi=0 and κmax=maxj∣κj∣. For a unit vector q near ±ei, put ε=1−qi2=∑j=iqj2, which is small and positive unless q=±ei. Since ∑j=iqj4≤ε2, we have F(q)=κi(1−ε)2+ρ with ∣ρ∣≤κmaxε2. If κi>0, then F(q)≤κi−2κiε+(κi+κmax)ε2<κi for 0<ε<2κi/(κi+κmax), while F(q)≥κi(1−ε)2−κmaxε2>0 for small ε; so ∣F(q)∣<∣F(±ei)∣. The case κi<0 is the same with all signs reversed.
No other local maxima. Let q be a local maximum of ∣F∣. Suppose first F(q)=0. Then F vanishes on a neighbourhood U of q in the sphere; since F(ru)=r4F(u), the polynomial F then vanishes on the open cone {ru:r>0,u∈U} of Rn, hence everywhere, so all κi=0, which is excluded. So F(q)=0, ∣F∣ is smooth near q, and q is a critical point of F with μ=F(q)=0, as described in Lemma 5.2引理 5.2. Suppose its support contains two indices i=j. Move along the great circle that rotates (qi,qj) and keeps the other coordinates fixed: qi=rcosϕ, qj=rsinϕ with r2=qi2+qj2. Along it F=C+r4h(u) with C constant, u=cos2ϕ and h(u)=κiu2+κj(1−u)2. The condition κiqi2=κjqj2 says that q sits at the stationary point u∗=κj/(κi+κj)∈(0,1) of the quadratic h, whose leading coefficient κi+κj has the sign of μ. If μ>0, h has a strict minimum at u∗, so the positive function F has a strict local minimum along the circle; if μ<0, h has a strict maximum at u∗ and the negative function F again has ∣F∣ minimal there. (Near u∗ the map ϕ↦u is a local diffeomorphism.) Either way q is not a local maximum of ∣F∣, a contradiction. Hence ∣S∣=1 and q=±ei with κi=0.
没有其他局部极大点。设 q 是 ∣F∣ 的局部极大点。先设 F(q)=0。则 F 在 q 在球面上的某个邻域 U 内恒为零;由于 F(ru)=r4F(u),多项式 F 在 Rn 的开锥 {ru:r>0,u∈U} 上恒为零,从而处处为零,即所有 κi=0,与假设矛盾。所以 F(q)=0,∣F∣ 在 q 附近光滑,q 是 F 的临界点且 μ=F(q)=0,其形式如Lemma 5.2引理 5.2所述。假设其支撑集含两个下标 i=j。沿着旋转 (qi,qj)、保持其余坐标不变的大圆移动:qi=rcosϕ,qj=rsinϕ,r2=qi2+qj2。沿此大圆,F=C+r4h(u),其中 C 为常数,u=cos2ϕ,h(u)=κiu2+κj(1−u)2。条件 κiqi2=κjqj2 说明 q 恰位于二次函数 h 的驻点 u∗=κj/(κi+κj)∈(0,1),而 h 的首项系数 κi+κj 与 μ 同号。若 μ>0,h 在 u∗ 处取严格极小,于是取正值的 F 沿该大圆取严格局部极小;若 μ<0,h 在 u∗ 处取严格极大,取负值的 F 在此处同样使 ∣F∣ 取极小。(在 u∗ 附近,ϕ↦u 是局部微分同胚。)无论哪种情形,q 都不是 ∣F∣ 的局部极大点,矛盾。所以 ∣S∣=1,即 q=±ei 且 κi=0。
Translation. The global maximum value is maxi∣κi∣ by Proposition 5.1命题 5.1. Finally q=±ei corresponds to w=A~q=±a~i, and then w⊤z=q⊤s=±si.
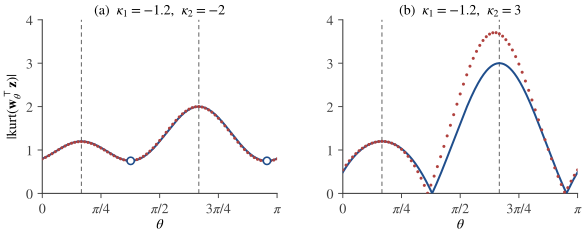
Figure 5.1图 5.1 shows the landscape for two sources. With two sub-Gaussian sources (a), ∣kurt∣ has its local maxima at the two source directions and local minima at the interior critical points, where tan2(θ−θ0)=κ1/κ2 and ∣kurt∣=∣(1/κ1+1/κ2)−1∣=0.75. With a sub- and a super-Gaussian source (b), there are no interior critical points with ∣S∣=2; instead the kurtosis changes sign between the source directions, and ∣kurt∣ drops to zero. In both cases every local maximum is a source, as the theorem says.
Figure 5.1. Absolute kurtosis of wθ⊤z, with wθ=(cosθ,sinθ)⊤, for two whitened sources whose directions are θ0=π/6 and θ0+π/2 (dashed). Lines: ∣κ1cos4(θ−θ0)+κ2sin4(θ−θ0)∣; dots: estimates from T=5000 samples. (a) Uniform and binary sources: open circles mark the interior critical points, which are minima of ∣kurt∣. (b) Uniform and Laplacian sources: the kurtosis changes sign between the sources. The estimate at the Laplacian direction overshoots by about 0.7, about 1.4 standard deviations of the standardized sample kurtosis at this sample size (Section 5.6第 5.6 节).图 5.1wθ⊤z 的峭度绝对值,其中 wθ=(cosθ,sinθ)⊤;两个白化源的方向为 θ0=π/6 与 θ0+π/2(虚线)。实线为 ∣κ1cos4(θ−θ0)+κ2sin4(θ−θ0)∣,圆点为由 T=5000 个样本得到的估计。(a)均匀源与二值源:空心圆标出内部临界点,它们是 ∣kurt∣ 的极小点。(b)均匀源与拉普拉斯源:峭度在两个源之间改变符号。拉普拉斯方向上的估计值偏高约 0.7,约为该样本量下标准化样本峭度标准差的 1.4 倍(Section 5.6第 5.6 节)。
Two practical remarks follow. First, the absolute value matters. Maximizing kurt itself finds super-Gaussian sources, but if all sources are sub-Gaussian then F<0 everywhere and its maximum is the critical point with the largest μ, which is the one with full support: the direction that mixes all sources (Exercise 5.2习题 5.2). An algorithm must either maximize ∣kurt∣ or kurt2, or know the sign of the kurtosis it is looking for. Second, a source with κi=0 produces no local maximum at all: kurtosis cannot see it, even if it is far from Gaussian. We return to this in Section 5.6第 5.6 节.
由此得到两点实际的提醒。第一,绝对值不能省。直接最大化 kurt 能找到超高斯源;但若所有源都是亚高斯的,则 F 处处为负,其最大值落在 μ 最大的临界点,也就是支撑集为全集的那个点:把所有源混在一起的方向(Exercise 5.2习题 5.2)。算法要么最大化 ∣kurt∣ 或 kurt2,要么事先知道所找峭度的符号。第二,κi=0 的源根本不产生局部极大点:即使它远离高斯,峭度也看不见它。我们将在Section 5.6第 5.6 节回到这一点。
5.4All components at once: Comon's contrast同时估计全部成分:Comon 对比函数
One-unit methods find the sources one at a time. To estimate all of them together, search over orthogonal matrices U, with outputs y=Uz, and add up a one-unit contrast over the outputs. Comon (1994) proposed the sum of squared kurtoses,
单单元方法一次只找一个源。若要同时估计全部源,可以在正交矩阵 U 上搜索,输出为 y=Uz,并把单单元对比函数对各个输出求和。Comon(1994)提出了峭度平方和
Ψ(U)=i=1∑nkurt(yi)2,y=Uz.(5.3)
For outputs that are symmetric and close to Gaussian, maximizing Ψ approximately minimizes their mutual information (Section 6.7第 6.7 节). With the orthogonal matrix Q=UA~ we have y=Qs, and by Proposition 5.1命题 5.1, kurt(yi)=∑jQij4κj.
For every orthogonal U, Ψ(U)≤∑jκj2. If at most one source has zero kurtosis, equality holds if and only if Q=UA~ is a signed permutation matrix, that is, if and only if U separates the sources.
对任意正交矩阵 U,Ψ(U)≤∑jκj2。若至多一个源的峭度为零,则等号成立当且仅当 Q=UA~ 是带符号的置换矩阵,即当且仅当 U 把源分离开。
Proof.证明
By the Cauchy–Schwarz inequality with weights Qij2, (∑jQij2⋅Qij2κj)2≤(∑jQij4)(∑jQij4κj2)≤∑jQij4κj2, because each row of Q has unit norm and so ∑jQij4≤1. Summing over i and using that each column also has unit norm,
由带权 Qij2 的 Cauchy–Schwarz 不等式,(∑jQij2⋅Qij2κj)2≤(∑jQij4)(∑jQij4κj2)≤∑jQij4κj2,因为 Q 的每一行都是单位向量,故 ∑jQij4≤1。对 i 求和,并利用每一列也是单位向量,得
Ψ(U)≤j∑κj2i∑Qij4≤j∑κj2(i∑Qij2)2=j∑κj2.
Equality in the last step requires ∑iQij4=1, i.e. column j equal to ± a standard basis vector, for every j with κj=0. These columns are orthonormal, so they occupy distinct rows; if at most one κj vanishes, the remaining column is a unit vector orthogonal to all the others and is therefore a signed basis vector too. Conversely, for a signed permutation each kurt(yi) equals one of the κj, each used once, and Ψ=∑jκj2.
Unlike the one-unit contrast, Ψ tolerates one source with zero kurtosis. It also has a useful interpretation. The sum of the squares of all fourth-order cumulants of y, ∑ijklcum(yi,yj,yk,yl)2, does not depend on the rotation and equals ∑jκj2 (Exercise 5.6习题 5.6). Maximizing the diagonal part Ψ is therefore the same as minimizing the sum of the squared cross-cumulants, which is the idea behind JADE (Chapter 9第 9 章).
To increase ∣kurt∣, take a step along the gradient multiplied by the sign of the current kurtosis, then renormalize. The second term of the gradient points along w; after normalization it only rescales the step, so it can be dropped:
为了增大 ∣kurt∣,沿梯度乘以当前峭度的符号走一步,再归一化。梯度的第二项沿 w 方向,归一化之后只改变步长,因此可以略去:
w←w+μsign(kurt(w⊤z))E[z(w⊤z)3],w←w/∥w∥.
With the expectation replaced by a sample average this is a batch algorithm; with one sample per step it is a stochastic (online) algorithm. Because ∣kurt∣ has no local maxima other than the sources (Theorem 5.3定理 5.3), gradient ascent with a small step size cannot be trapped at a spurious maximum. Its costs are a step size μ that must be tuned and only linear convergence.
A fixed-point iteration. At a critical point on the sphere the gradient (5.4) is parallel to w, so E[z(w⊤z)3]−3w is a multiple of w. Hyvärinen & Oja (1997) turned this condition into an iteration without a step size:
不动点迭代。在球面上的临界点处,梯度 (5.4) 与 w 平行,所以 E[z(w⊤z)3]−3w 是 w 的倍数。Hyvärinen & Oja(1997)把这个条件变成了一个无需步长的迭代:
w←E[z(w⊤z)3]−3w,w←w/∥w∥.(5.5)
In source coordinates the iteration is strikingly simple. For a unit vector q, expand E[si(q⊤s)3]=∑j,k,lqjqkqlE[sisjsksl]. By independence and zero means only the terms in which the indices pair up survive: all four equal to i, or one of j,k,l equal to i and the other two equal to some m=i. This gives qi3E[si4]+3qi∑m=iqm2=qi3(κi+3)+3qi(1−qi2)=κiqi3+3qi. Since A~⊤E[z(w⊤z)3]=E[s(q⊤s)3], the update before normalization is
Let rj=∣κj∣1/2∣qj∣. One step maps rj to rj3 up to a common normalizing factor, so all ratios are cubed: rj+/ri+=(rj/ri)3. If index i has the strictly largest ri at the start, every other ratio decays like (rj/ri)3k after k steps: the iteration converges cubically to q=±ei, that is, w→±a~i. Sources with zero kurtosis drop out after one step. This is FastICA with the nonlinearity g(u)=u3; Chapter 8第 8 章 derives FastICA as an approximate Newton method and analyses its convergence for general nonlinearities (Theorem 8.3定理 8.3).
Deflation. To find all sources, run the one-unit iteration repeatedly, each time in the orthogonal complement of the directions already found. Once w1=±a~i1 is known, the constraint w⊥w1 reads qi1=0 in source coordinates: the problem is the same with source i1 removed, and Theorem 5.3定理 5.3 applies to the remaining sources. This is the deflation approach of Delfosse & Loubaton (1995).
For p=1,…,n: draw a random unit vector w and repeat until ∣w⊤wold∣ is within a tolerance of 1: set w←E^[z(w⊤z)3]−3w, then w←w−∑k<p(wk⊤w)wk, then w←w/∥w∥. Store wp=w.
Return U=[w1,…,wn]⊤, the unmixing matrix W=UV and the outputs y=Uz.
import numpy as np

rng = np.random.default_rng(0)
T, n = 10000, 3
S = np.vstack([rng.uniform(-np.sqrt(3), np.sqrt(3), T),  # kurtosis -1.2
               rng.laplace(0.0, 1 / np.sqrt(2), T),       # kurtosis +3
               rng.choice([-1.0, 1.0], T)])               # kurtosis -2
A = rng.standard_normal((n, n))
X = A @ S

X = X - X.mean(axis=1, keepdims=True)                     # whiten: z = V x
d, E = np.linalg.eigh(np.cov(X))
V = E @ np.diag(d ** -0.5) @ E.T
Z = V @ X

U = np.zeros((n, n))                          # rows: directions found so far
for p in range(n):
    w = rng.standard_normal(n)
    w /= np.linalg.norm(w)
    for it in range(1, 101):
        y = w @ Z
        w_new = (Z * y**3).mean(axis=1) - 3 * w           # fixed point
        w_new -= U[:p].T @ (U[:p] @ w_new)                # Gram-Schmidt
        w_new /= np.linalg.norm(w_new)
        done = abs(w_new @ w) > 1 - 1e-12                 # converged
        w = w_new
        if done:
            break
    U[p] = w
    y = w @ Z
    kurt = np.mean(y**4) - 3 * np.mean(y**2)**2
    print(f"unit {p + 1}: {it} iterations, kurtosis {kurt:+.2f}")
print(np.round(U @ V @ A, 2) + 0.0)           # close to a signed permutation
On this run the three units converge in 6, 5 and 2 iterations and recover the uniform source (sample kurtosis −1.21), the binary source (−2.00) and the Laplacian source (+2.78), in that order. The last unit has no freedom left after deflation, so it converges at once. The global matrix is close to a permutation:
With exact expectations every unit would land exactly on a source. With sample averages the error in w1 is passed on to all later units through the orthogonality constraint, so errors accumulate along the deflation sequence. Symmetric orthogonalization, which updates all units in parallel, avoids this ordering (Algorithm 8.6算法 8.6).
The theory above uses exact expectations. In practice the kurtosis of each candidate projection is estimated from T samples, and the quality of the estimate decides whether the landscape of Figure 5.1图 5.1 can be seen at all. Kurtosis is a fourth-order statistic, so its estimate is governed by moments up to order eight.
上面的理论用的是精确的期望。实践中,每个候选投影的峭度都要从 T 个样本估计,估计的好坏决定了Figure 5.1图 5.1中的地形能否被看清。峭度是四阶统计量,所以它的估计受到直到八阶的矩的支配。
Proposition 5.6 (variance of the sample kurtosis)命题 5.6(样本峭度的方差)
Let y1,…,yT be independent copies of a variable y with known zero mean, unit variance and moments mk=E[yk] with m8<∞. Let m^k=T1∑tytk. For the raw estimator κ^=m^4−3m^22, T(κ^−κ) converges in distribution to N(0,V), and for the standardized estimator κ^s=m^4/m^22−3, T(κ^s−κ) converges to N(0,Vs), where
By the central limit theorem, T(m^2−1,m^4−m4) is asymptotically Gaussian with covariance entries Var(y2)=m4−1, Var(y4)=m8−m42 and Cov(y2,y4)=m6−m4. The map (a,b)↦b−3a2 has gradient (−6,1) at (1,m4), so by the delta method (Section A.8第 A.8 节) V=36(m4−1)−12(m6−m4)+(m8−m42), which is the stated expression. The map (a,b)↦b/a2−3 has gradient (−2m4,1) there, which gives Vs=4m42(m4−1)−4m4(m6−m4)+(m8−m42).
For the Gaussian, V=Vs=24, the familiar 24/T. For the uniform law V=1728/175≈9.87 but Vs=1152/875≈1.32, and for the Laplace law V=1656 and Vs=1188 (Exercise 5.5习题 5.5). In practice the kurtosis is usually computed on standardized data, as in the code and figure of this chapter, because whitening standardizes every projection. Standardization helps a great deal for light tails and little for heavy ones: with T=1000 samples the standard error of the standardized sample kurtosis is about 0.04 for a uniform source, whose kurtosis is −1.2, but about 1.1 for a Laplacian source, whose kurtosis is 3. Heavy tails make the estimate of a large kurtosis very noisy. Centering by the sample mean leaves both variances unchanged when m3=0, as for symmetric laws; otherwise it adds a term (Exercise 5.5习题 5.5).
Heavier tails. If m8=∞, for example for Student's t distribution with ν≤8 degrees of freedom, the sample fourth moment has infinite variance and the error of the sample kurtosis decays more slowly than 1/T. If m4=∞ (ν≤4), the kurtosis is not even defined, although the source is perfectly separable in principle.
更重的尾部。若 m8=∞(例如自由度 ν≤8 的 Student t 分布),样本四阶矩的方差为无穷大,样本峭度的误差衰减得比 1/T 更慢。若 m4=∞(ν≤4),峭度根本没有定义,尽管这样的源在原则上完全可以分离。
Outliers. A single observation x0 changes m^4 by about x04/T, so its influence is unbounded. A point ten standard deviations out, in a sample of T=1000, adds about 10 to the estimated fourth moment, far more than the kurtosis of any sub-Gaussian source. In one simulated sample of 1000 unit-variance uniform values, the sample kurtosis after standardizing was −1.18; appending a single value at 5 changed it to −0.64, and a single value at 10 to +7.13. One point out of 1001 turned a clearly sub-Gaussian sample into a strongly super-Gaussian one.
Sources with small kurtosis. Let s be uniform with probability 5/7 and Laplacian with probability 2/7, both components having unit variance. Then E[s4]=75⋅59+72⋅6=3, so kurt(s)=0, yet s is clearly not Gaussian: its density jumps at ±3. By Theorem 5.3定理 5.3 such a source creates no local maximum of ∣kurt∣, and two of them make Ψ blind to any rotation within their plane, since every projection onto that plane has zero kurtosis. More generally, a source whose kurtosis is small compared with the standard error V/T is invisible to kurtosis in practice, however non-Gaussian it may be in other respects.
峭度很小的源。令 s 以概率 5/7 服从均匀分布、以概率 2/7 服从拉普拉斯分布,两个分量的方差都为一。则 E[s4]=75⋅59+72⋅6=3,所以 kurt(s)=0;但 s 显然不是高斯的:它的密度在 ±3 处有跳跃。由Theorem 5.3定理 5.3,这样的源不会产生 ∣kurt∣ 的局部极大点;有两个这样的源时,Ψ 对它们所在平面内的任何旋转都无动于衷,因为该平面上的每个投影的峭度都为零。更一般地,只要一个源的峭度与标准误 V/T 相比很小,峭度在实践中就看不见它,无论它在其他方面多么非高斯。
All three weaknesses have the same cause: the function u4 grows fast, so the estimate depends on rare large values and needs high moments to be stable. Chapter 6第 6 章 derives contrasts from likelihood and information theory and approximates them with slowly growing functions such as logcoshu. Their sample averages have small variance under weak moment conditions, a single outlier has bounded or at most linear influence, and they respond to non-Gaussianity that kurtosis misses, including the zero-kurtosis source above (Figure 6.1图 6.1).
For whitened data a projection is y=q⊤s with ∥q∥=1, and kurt(y)=∑iqi4κi. Its absolute value never exceeds maxi∣κi∣: mixing cannot create kurtosis.
The local maxima of ∣kurt(w⊤z)∣ on the unit sphere are exactly ± the source directions with nonzero kurtosis (Delfosse & Loubaton, 1995). The other critical points, with qi2∝1/κi on a support of size at least two, are not maxima, so one-unit searches have no spurious solutions.
The absolute value matters: when all sources are sub-Gaussian, maximizing kurt itself finds the most mixed direction. Comon's contrast ∑ikurt(yi)2 over rotations is maximized exactly at separating solutions when at most one source has zero kurtosis.
The fixed-point iteration w←E[z(w⊤z)3]−3w acts as qi↦κiqi3 in source coordinates and converges cubically; deflation finds the sources one after another.
The sample kurtosis has variance about V/T, where V depends on moments up to order eight (24 for the Gaussian, more than 1000 for the Laplace law), unbounded sensitivity to outliers, and no response to non-Gaussian sources with zero kurtosis. These weaknesses motivate the contrasts of Chapter 6第 6 章.
Let s1,s2 be independent with unit variance. Compute the kurtosis of (s1+s2)/2 when (a) both sources are uniform, and (b) s1 is uniform and s2 Laplacian. (c) In case (b), find the angles θ for which cosθs1+sinθs2 has zero kurtosis.
By Proposition 5.1命题 5.1 with q1=q2=1/2, the kurtosis is 41(κ1+κ2). (a) 41(−1.2−1.2)=−0.6, half the kurtosis of each source. (b) 41(−1.2+3)=0.45, smaller in absolute value than both 1.2 and 3. (c) We need −1.2cos4θ+3sin4θ=0, that is tan4θ=0.4, so tanθ=±0.41/4≈±0.795 and θ≈±38.5∘ modulo 180∘. These combinations have zero kurtosis but are not Gaussian, because a non-Gaussian source enters with a nonzero weight (Fact 4.4事实 4.4).
Three independent uniform sources are whitened. Find the maximum of kurt(w⊤z), without absolute value, over unit vectors w, and describe the output at a maximizer. What happens if ∣kurt∣ is maximized instead?
对三个独立的均匀源做白化。在单位向量 w 上求 kurt(w⊤z)(不取绝对值)的最大值,并描述最大点处的输出。如果改为最大化 ∣kurt∣,结果如何?
Show solution查看解答
In source coordinates kurt=−1.2∑iqi4, so we must minimize ∑iqi4 on the sphere. By Proposition 5.1命题 5.1 the minimum is 1/3, attained when q12=q22=q32=1/3; the maximum kurtosis is −0.4, in agreement with Lemma 5.2引理 5.2: μ=(3/(−1.2))−1=−0.4. The output is (±s1±s2±s3)/3, an equal mixture of all three sources, the worst possible answer. Maximizing ∣kurt∣ instead gives the six points q=±ei, with ∣kurt∣=1.2, which are the sources (Theorem 5.3定理 5.3).
For two sources, put q=(cosθ,sinθ)⊤ and f(θ)=κ1cos4θ+κ2sin4θ. Find all critical points of f, compute f at the interior ones, and decide which critical points are local maxima of ∣f∣. Evaluate the interior critical point for κ1=−1.2, κ2=−2, as in Figure 5.1图 5.1(a).
对两个源,令 q=(cosθ,sinθ)⊤,f(θ)=κ1cos4θ+κ2sin4θ。求 f 的全部临界点,计算 f 在内部临界点处的值,并判断哪些临界点是 ∣f∣ 的局部极大点。对Figure 5.1图 5.1(a)中的 κ1=−1.2、κ2=−2,求出内部临界点。
Show solution查看解答
f′(θ)=4sinθcosθ(κ2sin2θ−κ1cos2θ). The zeros are θ=0 and θ=π/2 (modulo π), the two sources, and, if κ1κ2>0, the angles with tan2θ=κ1/κ2. There cos2θ=κ2/(κ1+κ2) and sin2θ=κ1/(κ1+κ2), so f=(κ1κ22+κ2κ12)/(κ1+κ2)2=κ1κ2/(κ1+κ2)=(1/κ1+1/κ2)−1, as in Lemma 5.2引理 5.2. With u=cos2θ, f=κ1u2+κ2(1−u)2 is a quadratic in u with leading coefficient κ1+κ2; when both kurtoses are positive the interior point is its minimum, when both are negative its maximum, and in both cases ∣f∣ is minimal there, with ∣f∣=∣κ1κ2∣/∣κ1+κ2∣<min(∣κ1∣,∣κ2∣). The sources are the local maxima of ∣f∣, with values ∣κ1∣ and ∣κ2∣. For κ1=−1.2 and κ2=−2: tan2θ=0.6, θ≈37.8∘ from the first source, and f=−0.75. When the kurtoses have opposite signs there is no interior critical point of f; instead f vanishes where tan4θ=−κ1/κ2, and ∣f∣ is minimal (zero) there.
All sources have the same kurtosis κ=0, and the iteration (5.5) starts from a unit vector with ∣q2/q1∣=1/2 and ∣qj∣≤∣q2∣ for j≥3 (exact expectations). How many iterations are needed until ∣qj/q1∣<10−8 for all j≥2? How many would a method need that squares the ratios at each step, or one that halves them?
By (5.6), normalization does not affect ratios, and with equal kurtoses qj+/q1+=(qj/q1)3. After k steps every ratio is at most (1/2)3k: 0.125, 1.95×10⁻³ and (1/2)27≈7.5×10−9 for k=1,2,3. Three iterations suffice. Squaring gives (1/2)2k, which falls below 10−8 only when 2k≥27, that is after k=5 steps. Halving gives (1/2)k+1, which needs k+1≥27, that is 26 steps. With sample averages the iteration converges to the fixed point of the sample criterion, which differs from the exact source direction by the statistical error discussed in Chapter 10第 10 章.
(a) Evaluate V and Vs in (5.7) for the Gaussian, the uniform and the Laplace laws with unit variance. (b) Suppose the data are centered by their sample mean yˉ before computing κ^. Show that this adds −4m3yˉ to κ^ up to terms of order 1/T, and that the asymptotic variance becomes V+64m32−8m3m5, which equals V for symmetric laws.
(a) Gaussian: m4=3, m6=15, m8=105, so V=105−9−180+144−36=24. Uniform on [−3,3]: m2k=3k/(2k+1), so m4=9/5, m6=27/7, m8=9 and V=9−81/25−324/7+432/5−36=1728/175≈9.87. Laplace with scale b=1/2: m2k=(2k)!b2k=(2k)!/2k, so m4=6, m6=90, m8=2520 and V=2520−36−1080+288−36=1656. For the standardized estimator the same moments give Vs=105−9+108−180=24 for the Gaussian, Vs=9−81/25+2916/125−972/35=1152/875≈1.32 for the uniform and Vs=2520−36+864−2160=1188 for the Laplace law. (b) With y~t=yt−yˉ, expanding the powers gives T1∑ty~t4=m^4−4yˉm^3+Op(1/T) and T1∑ty~t2=m^2−yˉ2, because yˉ=Op(T−1/2). Hence the centered estimate is κ^−4yˉm^3+Op(1/T)=κ^−4m3yˉ+op(T−1/2). So T times the error is asymptotically the normalized sum of y4−6y2−4m3y (minus its mean), whose variance is Var(y4−6y2)+16m32Var(y)−8m3Cov(y4,y)+48m3Cov(y2,y)=V+16m32−8m3m5+48m32, using Cov(y4,y)=m5 and Cov(y2,y)=m3. This is V+64m32−8m3m5. For a symmetric law m3=m5=0. For the centered exponential law (m3=2, m5=44) the value drops from V=11968 to 11520.
Let y=Qs with Q orthogonal and independent sources with kurtoses κp. (a) Show that cum(yi,yj,yk,yl)=∑pκpQipQjpQkpQlp. (b) Show that ∑i,j,k,lcum(yi,yj,yk,yl)2=∑pκp2 for every orthogonal Q. (c) Conclude that maximizing Ψ in (5.3) is equivalent to minimizing the sum of the squares of all fourth-order cross-cumulants of y, those whose four indices are not all equal.
(a) By multilinearity, cum(yi,yj,yk,yl)=∑p,q,r,tQipQjqQkrQltcum(sp,sq,sr,st), and for independent sources the cumulant vanishes unless p=q=r=t, in which case it is κp. (b) Squaring and summing,
because the columns of Q are orthonormal. (c) The terms with i=j=k=l add up to ∑ikurt(yi)2=Ψ, so Ψ plus the sum of the squared cross-cumulants equals the constant ∑pκp2. Maximizing one is minimizing the other; at a separating solution all cross-cumulants vanish.
Comon, P. (1994). Independent component analysis, a new concept? Signal Processing, 36(3), 287–314.
Delfosse, N., & Loubaton, P. (1995). Adaptive blind separation of independent sources: A deflation approach. Signal Processing, 45(1), 59–83.
Friedman, J. H., & Tukey, J. W. (1974). A projection pursuit algorithm for exploratory data analysis. IEEE Transactions on Computers, C-23(9), 881–890.
Huber, P. J. (1985). Projection pursuit. The Annals of Statistics, 13(2), 435–475.
Hyvärinen, A., Karhunen, J., & Oja, E. (2001). Independent Component Analysis. Wiley.
Hyvärinen, A., & Oja, E. (1997). A fast fixed-point algorithm for independent component analysis. Neural Computation, 9(7), 1483–1492.